
Timestamps
Timestamps, turn durations, and timing reports for Claude Code and Codex.
Long transcripts do not show how much time each turn or command took. Recorded timings make that information available in message markers, session reports, and model context.
- Bash
- Claude Code
- Codex
- hooks
- jq
GitHub (opens in a new tab)README (opens in a new tab)Changelog (opens in a new tab)
On this pageFunctionality
Functionality
Timestamps puts the time and the turn duration on assistant messages in Claude Code. Hooks record the timings and pass measured notes to the agent in Claude Code and Codex. Codex does not display the message marker.
A real Claude Code session played back at real speed, recorded with the project's own screenshot tooling.

Two fast turns are drawn dim. The third crossed the slow threshold, so its duration is coloured and, with TOOL_TIMING on, named after the tool behind it.
In Claude Code, every assistant message gets a marker like [13:22:13] in your own timezone, followed by how long the turn took, such as +2m14s, measured from prompt submission until the turn finishes. A turn that crosses a threshold you set gets its duration coloured, so you notice it instead of reading past it. With TOOL_TIMING on, the marker also names what made the turn slow: [13:22:13 +2m14s · Bash 1m58s]. A gap between two messages gets its own label, so a session you return to the next morning still reads in order, and the first message after midnight carries the date.
In both clients, hooks add measured timing notes to model context: prompt time, long turns, slow commands, time since the last active session, and the turn timeline after compaction. Recorded command durations provide a per-project baseline, with usually slow commands listed at session start.
On exit, a summary follows:
Session lasted 1h30m over 12 turns, 24m18s of it waiting, 35m00s away.
slowest tools: Bash 41.2s (18 calls), WebFetch 8.1s (1 call), Read 2.0s (37 calls). 2 failed
Waiting and away never cover the same seconds, so together they add up to no more than the session. The second line appears with TOOL_TIMING on.
codex exec does not display this summary at exit. With HISTORY=on, the totals are recorded in the session history and can be read with setup.sh --stats.
The marker is display only. It is drawn as messages render, never enters the transcript, and never reaches the model. Timing notes enter model context separately as short system reminders.
Quick start
Requires jq and bash, nothing else. If jq is missing, a startup message reports the dependency and the hooks remain inactive.
In Claude Code:
claude plugin marketplace add https://github.com/AraneaDev/aranea-marketplace
claude plugin install timestamps@aranea
In Codex:
codex plugin marketplace add AraneaDev/timestamps
codex plugin add timestamps@aranea
Until 0.0.38 the plugin was called Claude Timestamp (claude-timestamp). Claude Code reserves names starting with claude- for Anthropic's own plugins. If the old one is still installed, remove it first with claude plugin uninstall claude-timestamp@aranea, or every marker appears twice. Settings and history carry over. The settings command is now /timestamps:configure.
Hooks are bound when a session starts, so the plugin only takes effect in a new session. Codex also asks you to review and trust the plugin's hooks once; until you do, nothing is recorded.
The default configuration requires no setup. The first-run message lists where to change it.
Client support
What works depends on the client that runs the plugin, not on the model.
| Feature | Claude Code | Codex |
|---|---|---|
| Timestamp marker, idle divider and slow-turn colour | ✓ | ✗ |
| Prompt time, turn-length and slow-tool notes for the agent | ✓ | ✓ |
| Resumption note and the note after a compaction | ✓ | ✓ |
| Command memory and the usually-slow note | ✓ | ✓ |
Turn timeline, session history and --stats | ✓ | ✓ |
time-awareness skill | ✓ | ✓ |
/timestamps:configure command | ✓ | ✗ |
Codex has no event for drawing on a message, so it gets no marker, and its tool timings are whole seconds. The full table is in the README.
Examples
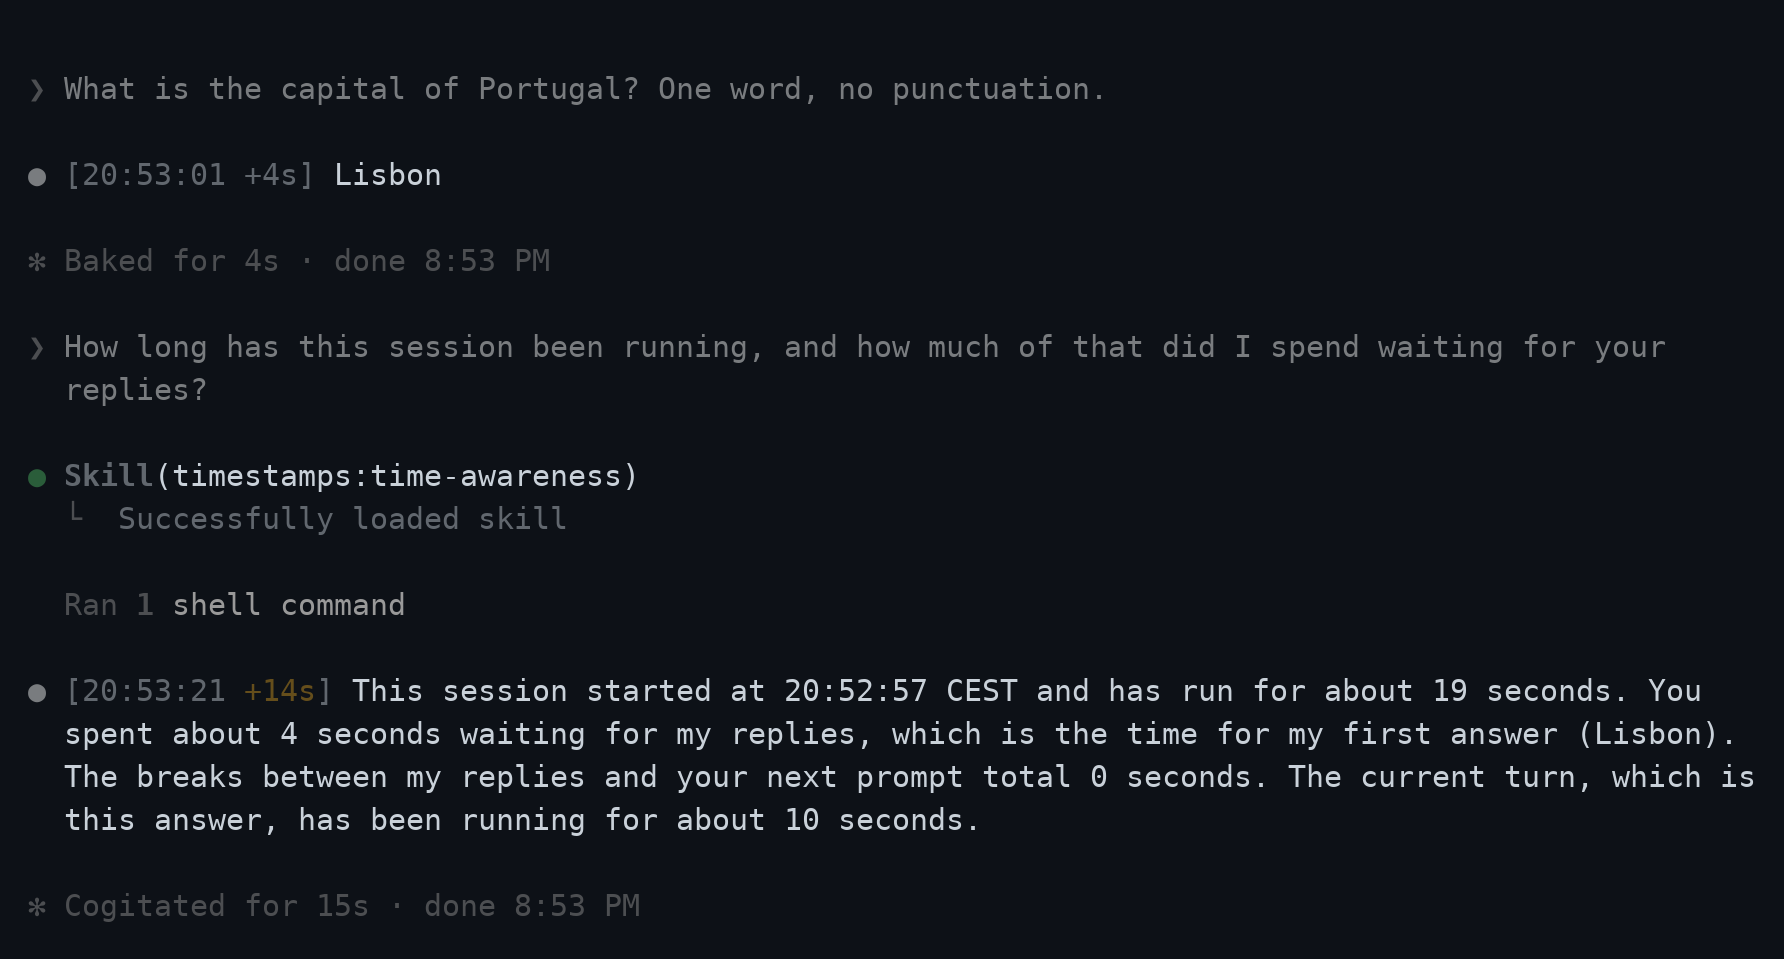
A session-duration question triggers the bundled skill and session report. The response uses the measured values.
Timing notes in model context
Each note is a short system reminder that states a fact and nothing else. The advice lives in one place, the bundled time-awareness skill, loaded when a note arrives or a timing question is submitted.
| When | What the agent reads |
|---|---|
| Every prompt | Message sent at local time 10:37:21 CEST, after a 3h break |
| A turn passes 15 minutes, and every 15 after | Turn running 15m02s (prompt sent 10:37:21); now 10:52:23 CEST. |
| One tool call takes a minute or more | That Bash call took 6m10s (usually 4m02s). |
| A session starts after a gap of an hour or more | Previous session in this project ended 14h ago (Thu 20:12:05). |
| A conversation is compacted | Conversation compacted. Session started 09:12:05 (3h04m ago), 41 turns so far, 1h02m of it waiting. |
| A session starts in a project with slow commands | Usually slow in this project: bash tests/run.sh ~4m02s (12 runs). |
The skill provides instructions for responding to these measurements: check the work against the request after a long stretch, run a command that usually takes minutes in the background, wait for CI as long as CI actually takes instead of polling, and re-check the branch after a gap. INJECT_CONTEXT=false switches every note off and keeps the visible marker.
A note can only reach the agent when a hook runs, so the turn-length note waits for the next tool result. A single 31-minute command produces one note when it finishes, not one at 15 minutes and another at 30.
Recorded timing data
Every turn goes into a timeline for the session: when it started, how long it took, and with TOOL_TIMING on which tool took most of it. Shell-command durations are stored per project, under a short key such as npm test or bash tests/run.sh. The key is the program and at most two plain arguments: never the full command line, quoted text, a flag, a URL, a host or a path outside the project, and never what echo or printf print.
bash "$CLAUDE_PLUGIN_ROOT/hooks/scripts/setup.sh" --turns
bash "$CLAUDE_PLUGIN_ROOT/hooks/scripts/setup.sh" --commands
Both take --json, which is what the agent reads. COMMAND_MEMORY=off stops the command memory, and deleting ~/.claude/claude-timestamp-commands.tsv clears the recorded durations.
Configuring it
/timestamps:configure shows what you have now and offers a handful of presets, each previewed as the marker it actually produces.
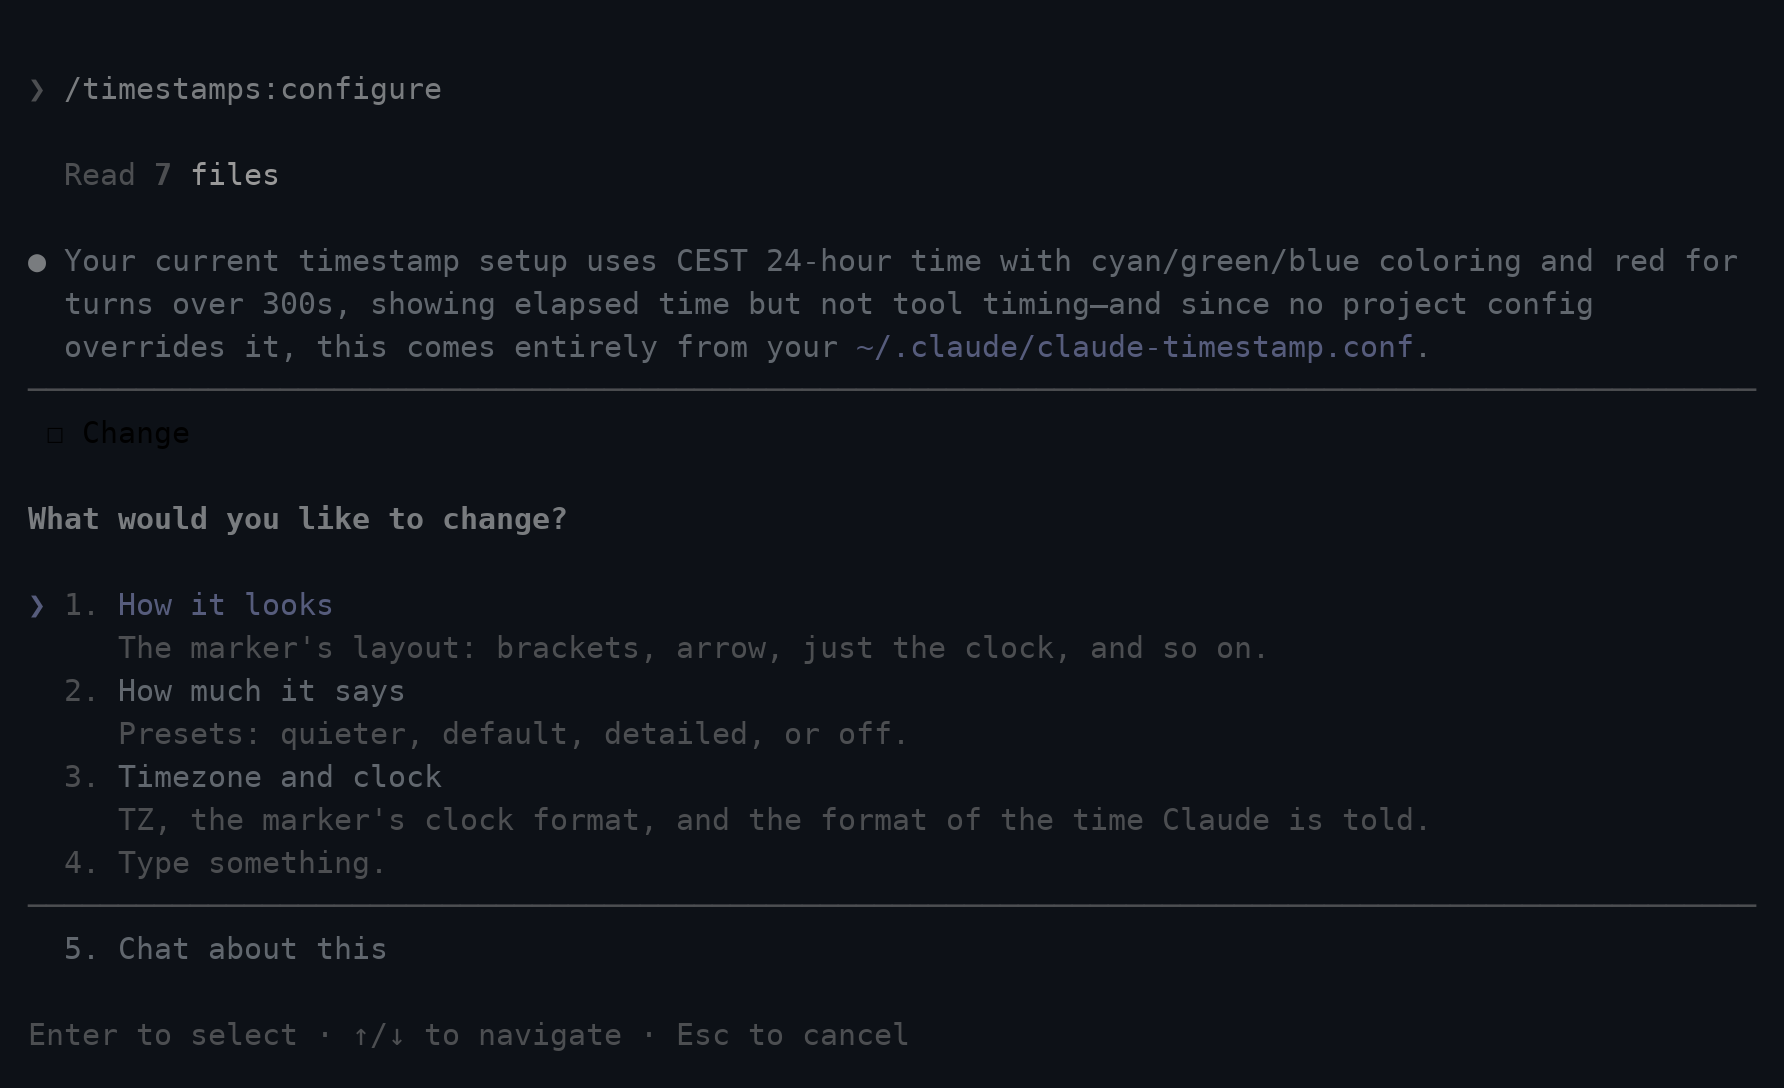
The command also takes a request directly, so /timestamps:configure tokyo, /timestamps:configure no colour and /timestamps:configure 12 hour clock each land in one step. Changes take effect on your next message, because every hook reads the config file each time it runs. Only installing needs a new session, since that is when hooks are bound. In Codex, the bundled timestamps skill or the setup script below do the same.
Nothing about this runs a shell script. /timestamps:configure reads schema.json, which ships with the plugin and describes every setting, and edits your config file directly.
What the marker looks like
MARKER defines what the marker is made of and how it is arranged. The parts are %time, %elapsed, %tool and %date, and a {...} group disappears when every part inside it is empty, so an empty duration does not leave stray brackets in the marker:
MARKER=                                          renders as

[{%date }%time{ %elapsed}{ · %tool}]             [13:22:13 +2m14s · Bash 1m58s]
%time                                            13:22:13
%time{ %elapsed}                                 13:22:13 +2m14s
%time{ → %elapsed}                               13:22:13 → +2m14s
Writing a template yourself is optional. /timestamps:configure supports named marker formats: /timestamps:configure no brackets and /timestamps:configure just the clock each set the matching MARKER.
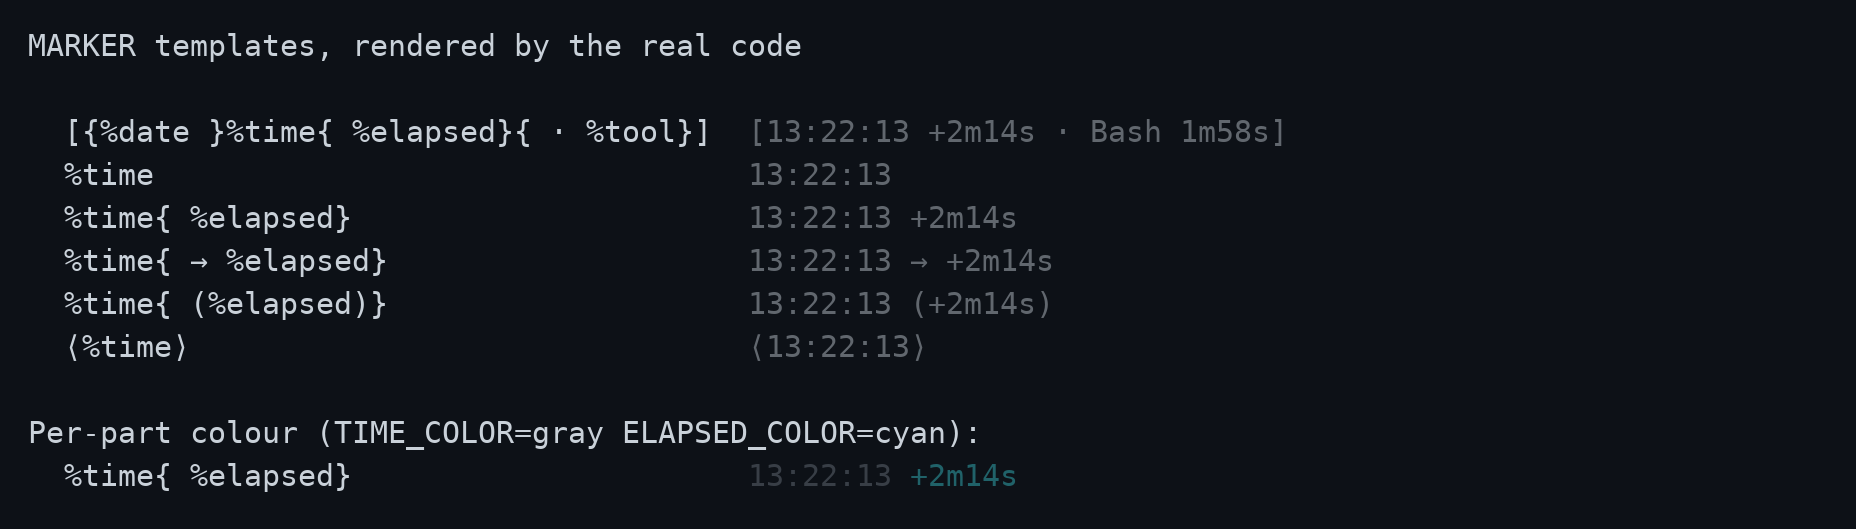
The time, the duration and the tool each take their own colour, through TIME_COLOR, ELAPSED_COLOR and TOOL_COLOR. Leave one empty and that part follows COLOR. A slow turn still uses SLOW_COLOR: it wins over ELAPSED_COLOR once the turn crosses SLOW_AFTER, because standing out is the whole point.
From a terminal
If you would rather answer the questions yourself, run the setup script's interactive wizard. It needs a real TTY, so run it in a terminal rather than asking the agent to run it.
bash "$CLAUDE_PLUGIN_ROOT/hooks/scripts/setup.sh"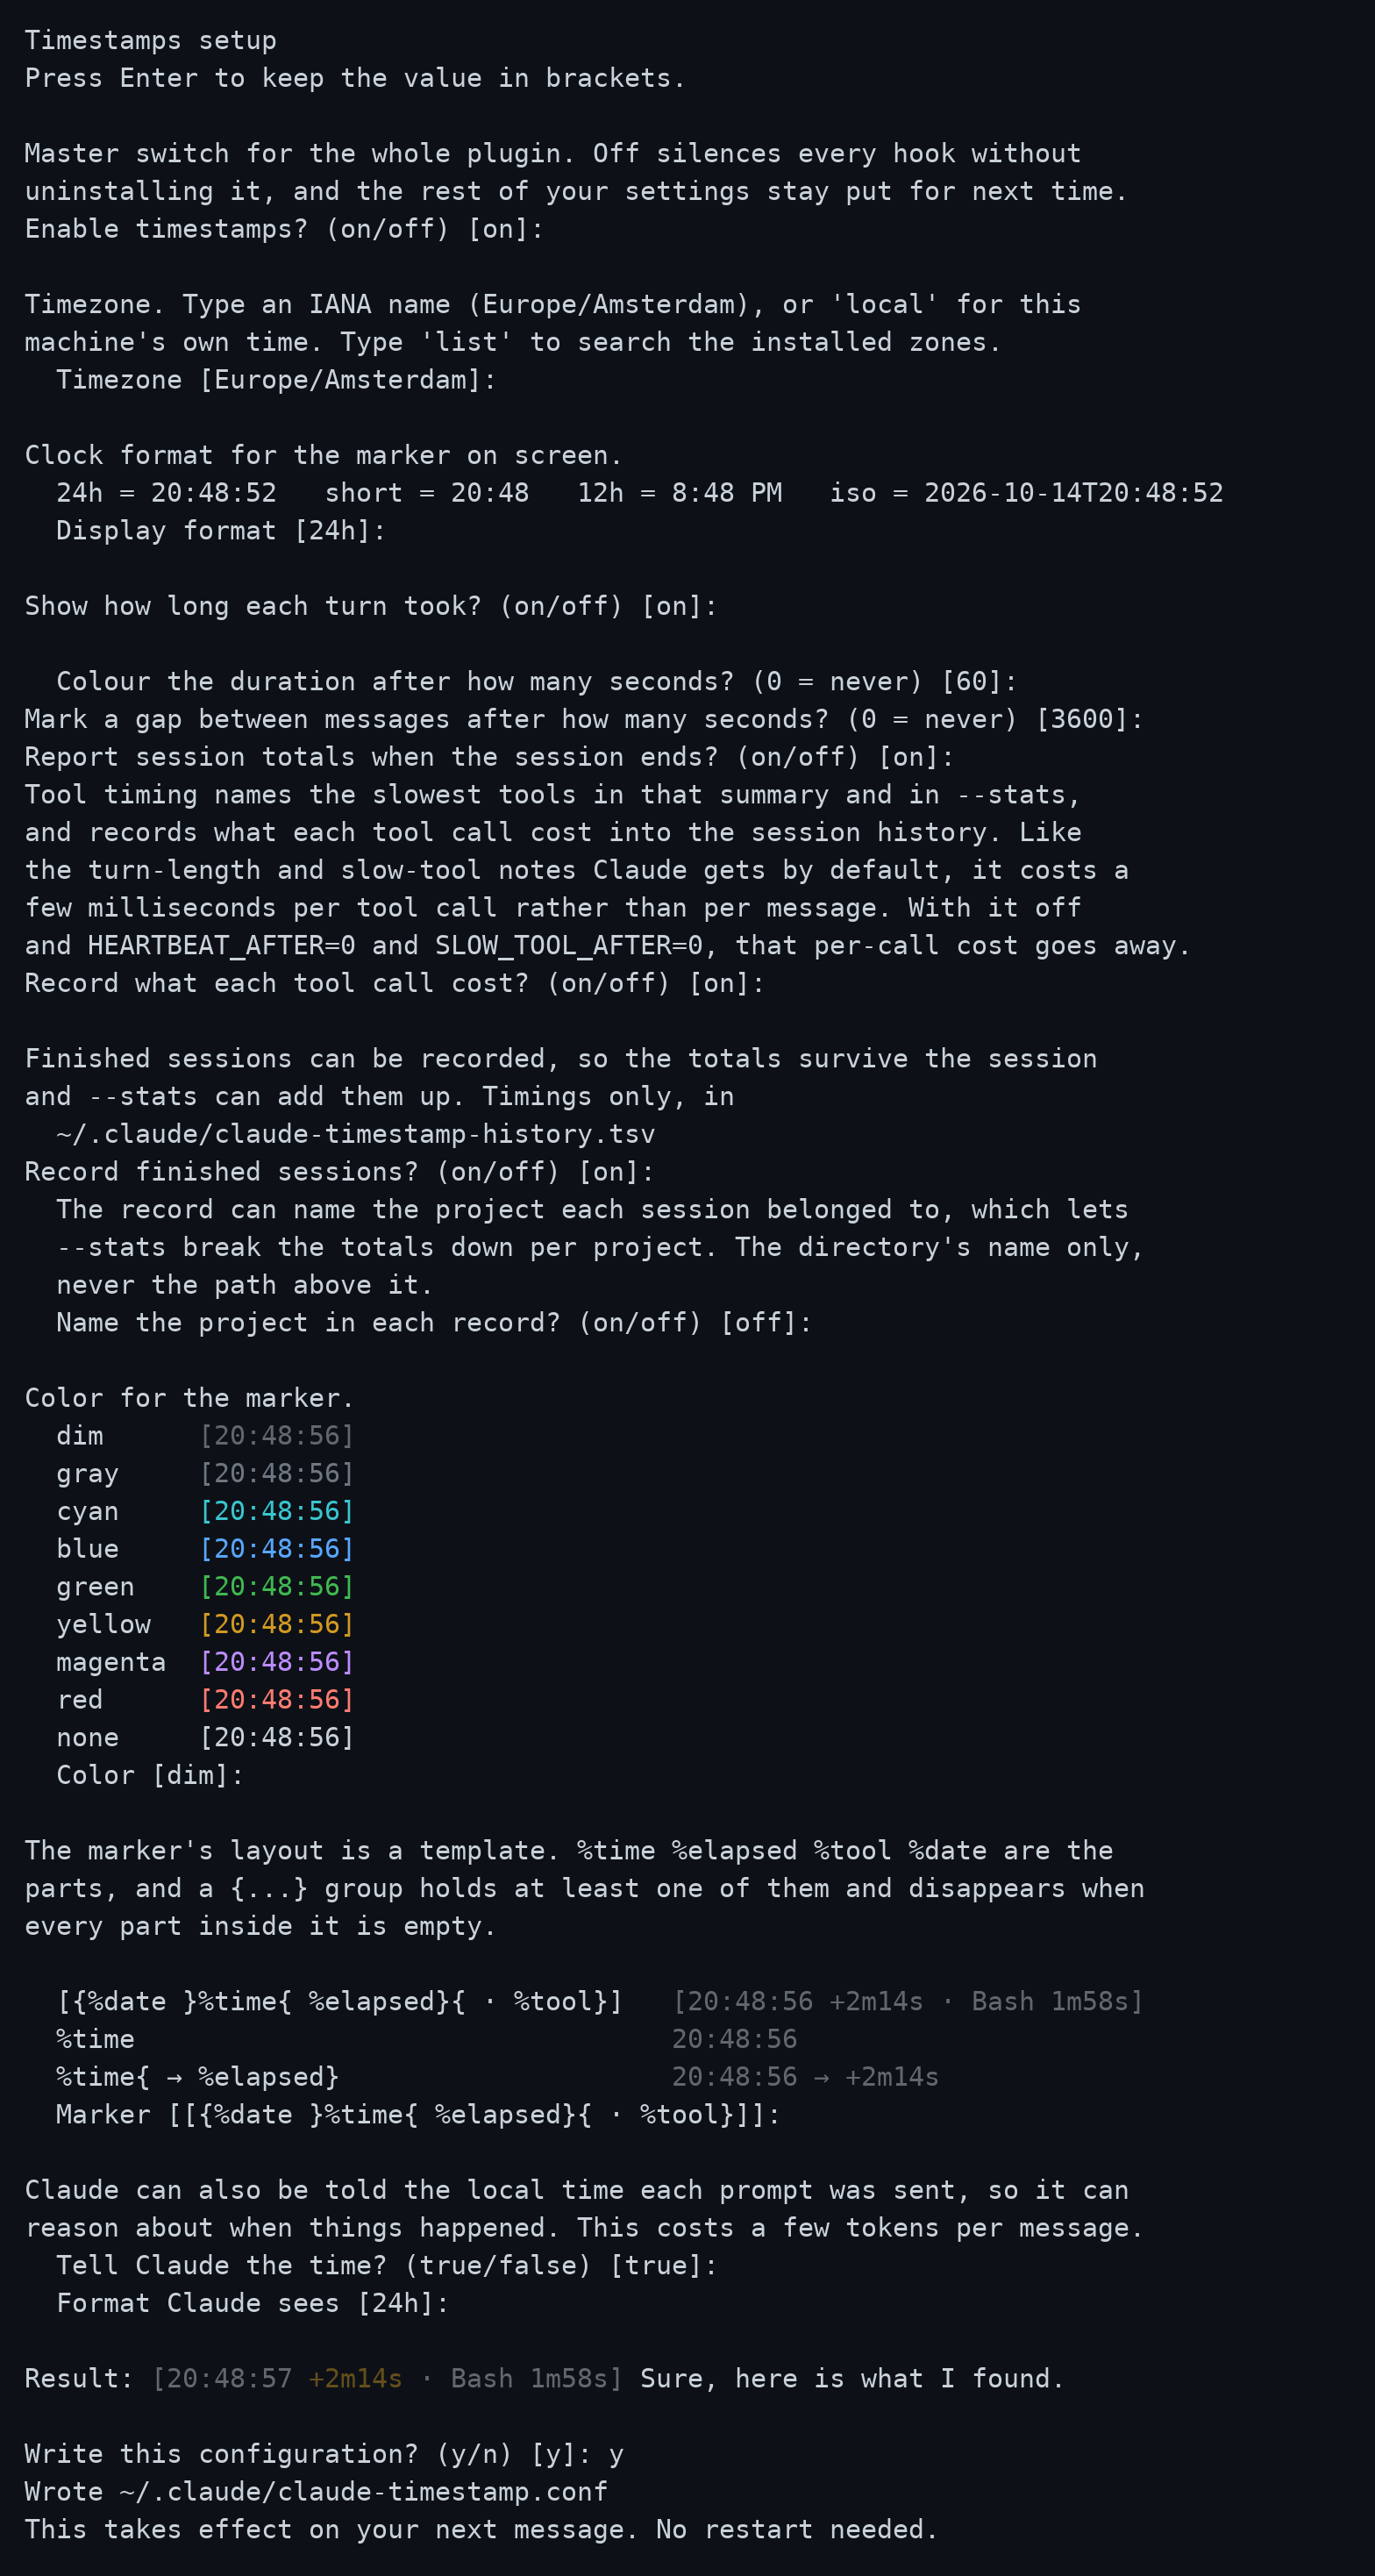
Every question shows its current value in brackets, and pressing enter keeps it. The colour list and the result line are rendered by the same code that draws the real marker, so a preview cannot drift from what you will actually see.
It also takes flags, so several settings can be set in one call:
setup.sh --tz=Asia/Tokyo --display=short --color=dim --slow-after=30Every flag is optional and anything you leave out keeps its current value.
Project settings
A project can carry its own settings in .claude/claude-timestamp.conf, layered over yours. Only the keys it names are overridden, so a repository can pin one thing and leave the rest following your own configuration:
cd some-project
bash "$CLAUDE_PLUGIN_ROOT/hooks/scripts/setup.sh" --project --tz=UTC
That writes only TZ=UTC. Everything else still comes from your own configuration. The file is found by walking up from the directory the conversation is about, so it applies from subdirectories too, and the search stops at your home directory so your own config is never mistaken for a project one.
Session totals
Ask for session duration or waiting time in the chat. The response uses recorded session timings and history; no terminal command is required.
For a terminal view, run the script instead:
bash "$CLAUDE_PLUGIN_ROOT/hooks/scripts/setup.sh" --session
bash "$CLAUDE_PLUGIN_ROOT/hooks/scripts/setup.sh" --stats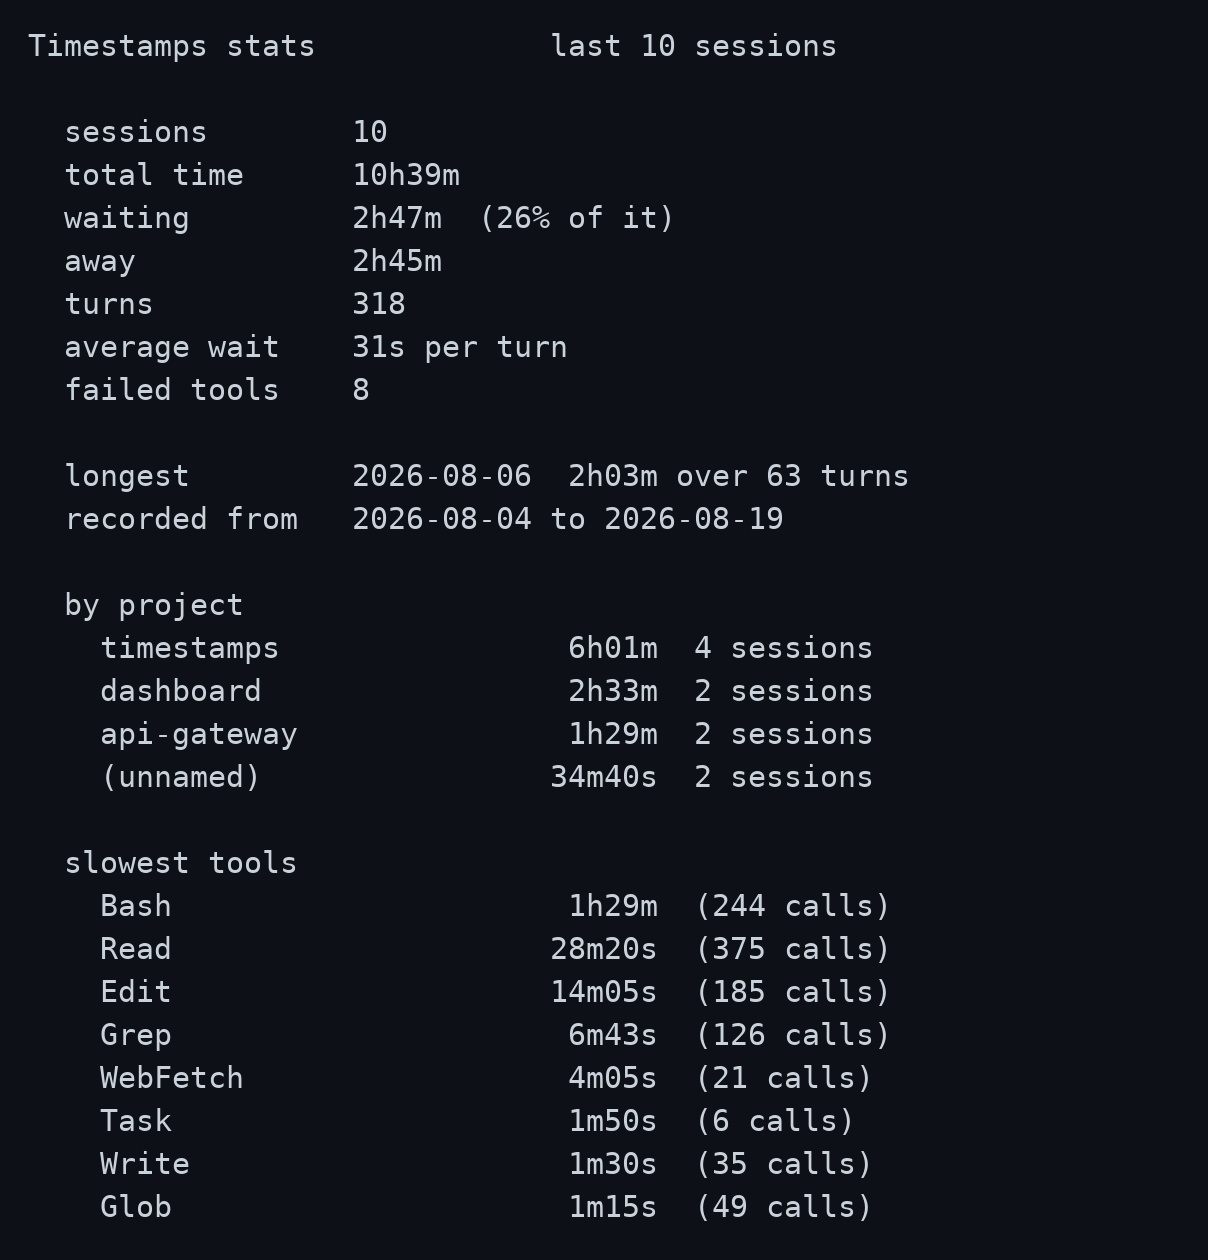
The history file records completed sessions. Entries beyond HISTORY_LIMIT are removed, oldest first.
A row is five numbers and a date. That says how long a session took and how much of it was waiting, never what it was about. PROJECTS=on names the project a session belonged to, TOOL_TIMING=on records what each tool cost, and the report then breaks the totals down instead of only adding them up:
  by project
    timestamps               18h02m   28 sessions
    ratio                     9h15m   14 sessions
    (unnamed)                 3h55m    5 sessions

  slowest tools
    Bash                      6h20m  (1204 calls)
    WebFetch                    41m  (  88 calls)
Sessions recorded before you switched PROJECTS on still count, grouped under (unnamed). Two flags narrow the report, by date and by project:
bash "$CLAUDE_PLUGIN_ROOT/hooks/scripts/setup.sh" --stats --since=7d
bash "$CLAUDE_PLUGIN_ROOT/hooks/scripts/setup.sh" --stats --project=timestamps
The file holds timings only: no message text, no tool arguments, and no paths. With PROJECTS=on it also holds the project's directory name, never the path above it, and never your home directory's own name for a session run from there. With TOOL_TIMING=on it holds which tools took how long. Both are off until you turn them on, and HISTORY=off switches the record off entirely.
Troubleshooting
A question about missing timestamps triggers a check of the facts file and configuration against schema.json. The resulting response lists the detected settings and platform limitations. The most common cause is ENABLED=off, easy to set and forget since it silences every hook without a trace on screen.
For a terminal check, run doctor instead:
bash "$CLAUDE_PLUGIN_ROOT/hooks/scripts/setup.sh" --doctor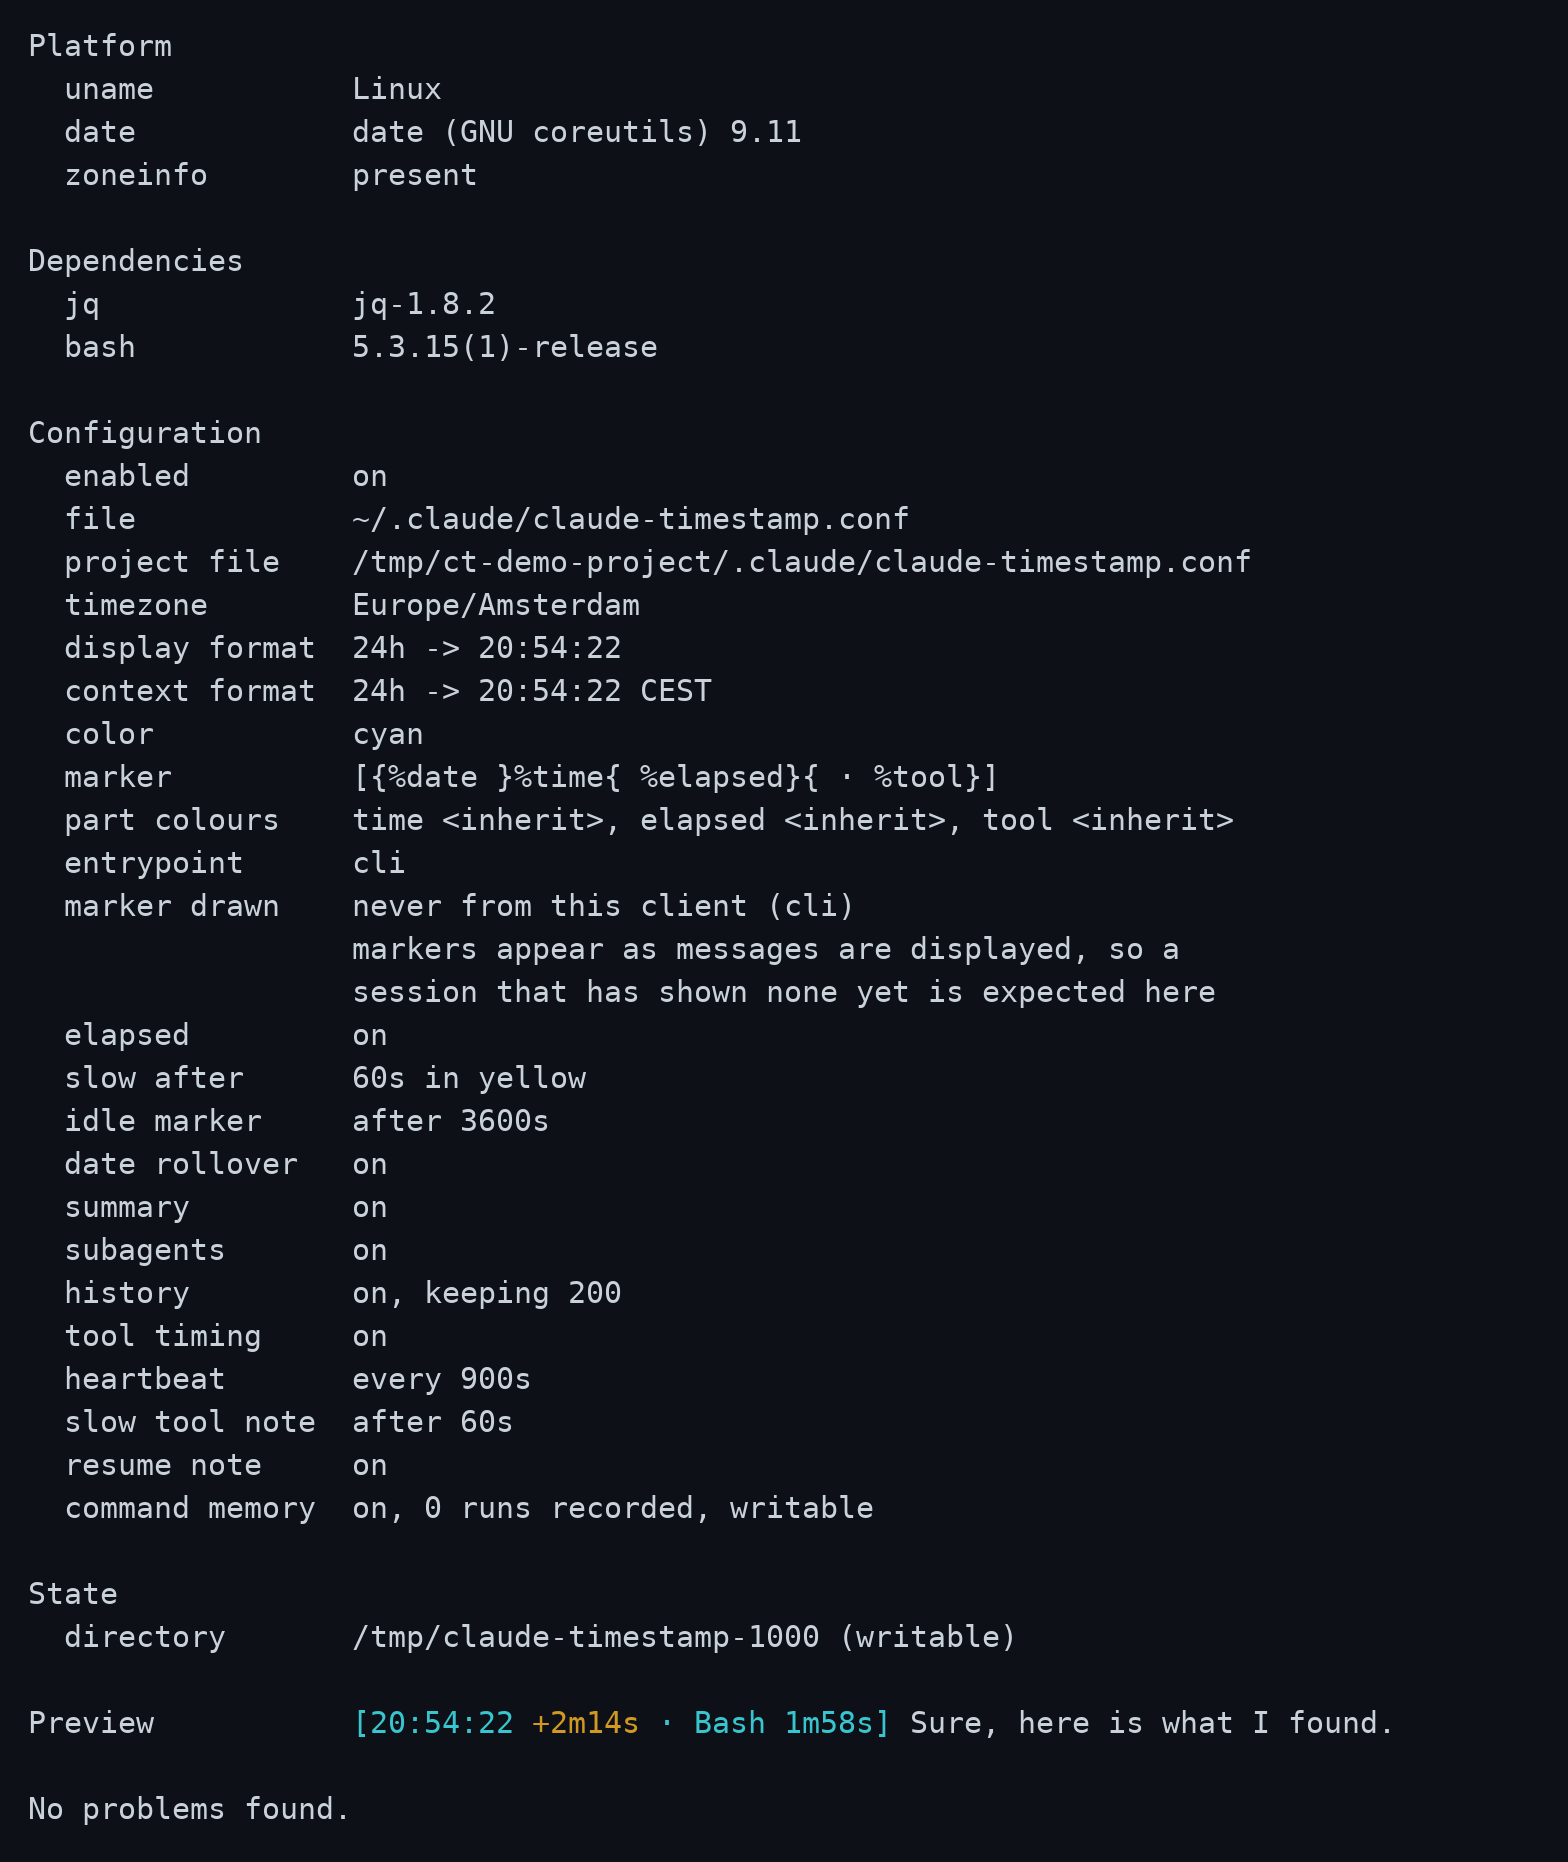
It checks that jq is present, that the config parses, that a pinned timezone can actually be applied on this machine, and that the state directory is writable, and exits non-zero if any of that fails. It also reports whether the command memory can be written, and when this client last drew a marker; "never" is expected until a message has been displayed. And it reports whether ENABLED is on: switching the plugin off on purpose is not itself a problem, so that line alone will not fail the check, but it is usually why you ran doctor in the first place.
How it works
Each hook writes a small state update and exits without blocking the session. Three hooks add timing notes to model context when the configured conditions are met. INJECT_CONTEXT=false disables those notes; the remaining state stays in the client harness and uses no model context.
| Hook | Job |
|---|---|
SessionStart | Check jq, prune old state, add context about a resumed project, a compaction or slow commands |
UserPromptSubmit | Open the turn, add the local time to model context |
MessageDisplay | Draw the marker on the first batch of each message (Claude Code only) |
PreToolUse | Codex only: note when a call started, since Codex sends no duration |
PostToolUse / PostToolUseFailure | Record the call, add slow-call or long-turn context, store the command duration |
Stop | Close the turn and add it to the timeline, in both clients |
StopFailure / Interrupt | Claude Code records an API failure as error; Codex records an interrupted turn as interrupted |
SessionEnd | Report the summary, record the session, prune the command memory, clear the state |
A turn's duration comes from Stop rather than from a guess about which messages went past. That is the difference between "the last message has been drawn" and "the agent is done".
MessageDisplay fires repeatedly as a message streams. Only the first batch is stamped; the rest return nothing at all, which Claude Code reads as "show the original text". Returning the text unchanged would have meant a wasted round trip on every batch of every message.
Timing state lives in $TMPDIR/claude-timestamp-<your uid>, one small set of files per session, cleared when the session ends and pruned after seven days. The uid is in the name because $TMPDIR is shared ground on a multi-user machine: the directory is created private to you, and one belonging to somebody else is declined rather than written into.
Configuration
Settings live in ~/.claude/claude-timestamp.conf as KEY=value, parsed against a list of known keys and never executed, so a stray line in it cannot run anything. Both clients read the same file.
| Setting | Default | Functionality |
|---|---|---|
ENABLED | on | Master switch; off silences every hook without uninstalling it |
TZ | machine local | IANA name such as Europe/Amsterdam, or empty for local time |
DISPLAY_FORMAT | 24h | 24h, short, 12h, iso, or any strftime string |
CONTEXT_FORMAT | 24h | The same values, for the time the agent is told |
COLOR | dim | none, dim, gray, red, green, yellow, blue, magenta, cyan |
MARKER | [{%date }%time{ %elapsed}{ · %tool}] | The layout, built from %time, %elapsed, %tool and %date |
TIME_COLOR | empty | Colour of %time and %date; empty follows COLOR |
ELAPSED_COLOR | empty | Colour of %elapsed; SLOW_COLOR wins on a slow turn |
TOOL_COLOR | empty | Colour of %tool; empty follows COLOR |
ELAPSED | on | Show how long the turn took |
INJECT_CONTEXT | true | Add the local time to model context each prompt was sent; false also silences every other note |
HEARTBEAT_AFTER | 900 | Add the open turn's elapsed time to model context, at the first tool result after each interval; 0 disables |
SLOW_TOOL_AFTER | 60 | Add context when a tool call takes at least this many seconds; 0 disables |
RESUME_NOTE | on | Add time since the last active session and the timeline after compaction |
COMMAND_MEMORY | on | Record command durations per project, and name the slow ones at session start |
SLOW_AFTER | 60 | Colour the duration past this many seconds, 0 disables |
SLOW_COLOR | yellow | Colour used for a slow turn |
IDLE_AFTER | 3600 | Mark a gap this long between messages, 0 disables |
DATE_ROLLOVER | on | Show the date on the first message after midnight |
SUMMARY | on | Report session totals on exit |
SUBAGENTS | on | Stamp subagent messages as well, and add slow-call context to subagent sessions |
TOOL_TIMING | off | Time individual tool calls and name the slowest |
HISTORY | on | Record each finished session, for /timestamps:configure and --stats |
HISTORY_LIMIT | 200 | How many recorded sessions to keep |
PROJECTS | off | Name the project in each recorded session; the directory name, never a path |
NO_COLOR disables colour whatever COLOR says.
A value the plugin cannot use is replaced by its default, and that is not done silently: it is named at the start of the next session and by --doctor.
Clock formats render as 14:03:22 for 24h, 14:03 for short, 2:03 PM for 12h, and 2026-08-19T14:03:22 for iso. Any value containing a % is treated as a strftime string, so the escape hatch needs no separate setting.
Four settings cost something per tool call rather than once per message: TOOL_TIMING, HEARTBEAT_AFTER, SLOW_TOOL_AFTER and COMMAND_MEMORY, a few milliseconds each call while any of them is on. With all four off, the tool hook exits before it reads anything.
Alongside the config, the plugin writes ~/.claude/claude-timestamp.facts.json at the start of every session. It holds what cannot be worked out by reading the configuration: whether this machine has a timezone database, whether the state directory is writable, and which version is installed. That is what lets /timestamps:configure answer questions about your setup without running anything.
Platform notes
Tested on Linux, macOS and Windows on every push, and on macOS under the bash 3.2 it still ships. Git Bash on Windows ships without a timezone database: date there silently falls back to UTC for any IANA name it cannot resolve. The plugin detects this, uses local time instead, mentions it once at session start, and prevents an unsupported pinned zone from being saved. UTC and GMT still work, since those need no database.
The plugin does not time tool calls itself in Claude Code: Claude Code reports how long each one took and the hook only reads that number off the payload. Codex sends no duration, so there the plugin measures from the call's start to its end, in whole seconds.